
Four or five… You may have heard of the handful of core “Vs” of big data, namely Volume, Variety, Velocity, Veracity and Value. But have you heard of nine, or even 17!?
Just when big data was becoming a hot topic, back in 2017, the International Research Journal of Engineering and Technology published a paper that argued how big data needed way more ‘core Vs’ to be handled efficiently. They identified 14, which quickly ended with 17.
Let’s first have a recap of what big data entails. At its most basic level, we’re talking about a combination or collection of data sets that grows day by day. Everyone creates data constantly, whether on the phone, on the web, or on social media. This data is usually gathered by organizations whom business depends on facing big data challenges while improving their operational efficiency. Ultimately, big data are extremely large data sets that are dealt with systematically to reveal associations, patterns and trends relating to human behaviours that help address business problems that could never be tackled with traditional data processing software.
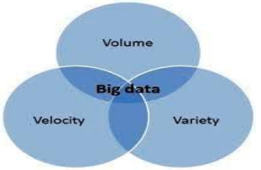
The talk of “Vs” first began with Gartner analyst Doug Laney in 2001, which came up with the initial three: Volume, Variety, and Velocity. Companies like Oracle have stuck with these three ever since.
Why not Value and Veracity?
Because it’s of no use unless your data gets discovered in the first place. …or is it?
Some argue that finding merits or truths in data goes past the scope of big data; they’re about what analysts can do during and after the discovery process. It’s already about business users asking the right questions, recognizing patterns, and predicting behaviours.
In other words, some end their definitions and implications of Big Data when it is collected and stored. When it’s about turning it into information by assessing its Value, or looking into its accuracy & quality (Veracity), another door is opened. Inversely, as I mentioned earlier, some go as far as identifying 17 Vs. They consist of:
Validity (authenticity), Volatility (duration of usefulness), Visualisation (process), Virality (spreading speed), Viscosity (Lag of event), Variability (differentiation), Venue (different platform), Vocabulary (terminology), Vagueness (indistinctness of existence), Verbosity (redundancy), Voluntariness (contextual availability), Versatility (contextual flexibility) and, as a C amongst Vs, Complexity (correlation). You can read more about each here.
I think defining so many elements as being core of Big data becomes convoluted, and while they’re certainly all worth knowing about, the simplicity of the four, or “Five Vs” is lost. Ultimately, they’re all about maximizing the usability of said big data, and increasing ROI for the business. Without veracity and value, you’re left with enormous data sets with no purpose.
While Oracle may not agree with the new additions, IBM also follows the 5 Vs format. Meanwhile, Microsoft recognises 6:
Beyond the ones we are familiar with; Volume, Variety, Velocity, Veracity and Value, they add one more: Visualization. As SPSS, R, or Excel can plot graphics of any given data, they argue that Big Data cannot properly be interpreted or used without visualisation. Whether it’s a bar chart, table, or infographic linking to KPIs, visuals are needed in order to bring teams or organizations to the same page.
You may already be familiar on how Value is already an often controversial inclusion, as data with context, or with meaning, is usually considered Information. But what is your take on visualization? I believe it to be an interesting addition, but does it really belong? What about Value?
I’d love to hear which one you’d include if you had to create your own “Core Vs of Big Data”. Let me know!