A fusion of giants: combining social sciences with data science

9

October

2019

No ratings yet.

Social data science is a (relatively) new discipline that aims to combine the mass information gathered from social sciences with the powerful algorithms and tools utilized in data science. To further the understanding of this new field, a few examples are highlighted throughout this article to not only grasp a better understanding of what currently can be done, but also gain insights on what could be the future of social data science with the increasing amounts of data being generated.

We begin with the example of forecasting elections. Initially, this doesn’t sound too difficult right? That’s because it isn’t. It isn’t when you have a representative sample (that is, asking the people what they are going to vote). This works, but costs money and time. Alongside this, when combined with the fact that response rates are declining, this will only become increasingly problematic as a pure indication. To combat this, researchers from Columbia University (from the department of Political Science and Statistics, respectively) found with proper statistical adjustment, they were able to utilize the non-representative samples to generate election forecasts that were not only faster, but also more accurate than the traditional representative sampling method. They indicate that such methods could further be utilized on a range of economic, social and cultural topics, clearly indicating the powerful conjunction between the fusion of the two disciplines regarding prediction models (Wang et al., 2015).

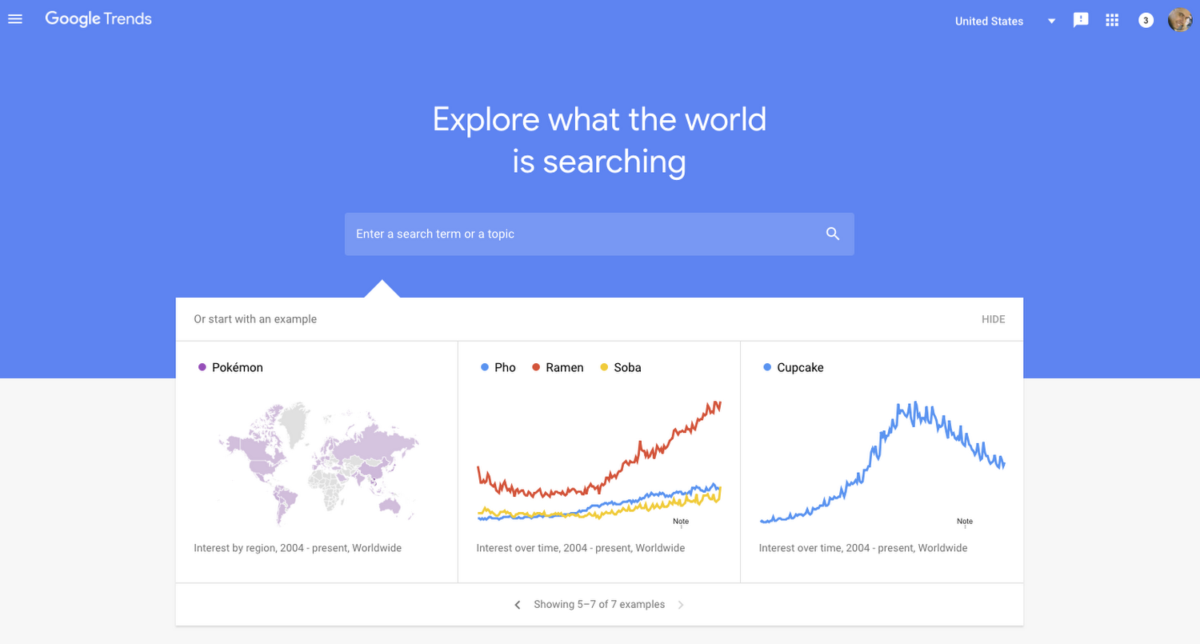
The second example I want to highlight is the “nowcasting” that can be done with google trends, a direct measurement of social queries (indicating needs on a large scale). By using google trends data, researchers have been able to “nowcast” key statistics such as unemployment, tourism levels in countries and purchase rates for motor vehicles. By analyzing this, the researchers claim a useful short-term economic prediction is able to be made and decisions can be made without having to wait for official (typically delayed) releases by government institutions (Choi and Varian, 2012). These three examples are just the tip of the iceberg regarding what can be achieved by analyzing google trends given the plethora of possible queries and the subsequent “nowcasted” models that can be built on the social data gathered and publicly published.

In our final example, researchers were faced with the issue of collecting data on the current economy in developing countries given the constraints regarding reliability and costs of data collection. To overcome this with social data science, researchers utilized metadata from (the ubiquity of) mobile phones in Rwanda to create a model capable of inferring the socioeconomic status of individuals (Blumenstock, Cadamuro and On, 2015) . If replicated in other developing countries, this approach promises adequate measurements of economic quantities required in market research for a much cheaper price than the traditional methodology for collecting data.

Evidently the fusion of social science and data science (social data science) allows for new approaches to forecasting, nowcasting and revolutionized market research of what was once considered less relevant or difficult to obtain data. These papers are merely the tip of the iceberg regarding what can be done with the current existing datasets but demonstrate a clear path towards what can be done in the future with even more data and computing power. Perhaps that are ethical consequences that could impede on the future of these developments, but one thing is clear to me – an understanding of what it is and how it can be used remains a crucial element to dealing with the potential concealed effects. And this article is a great start for that.


Blumenstock, J., Cadamuro, G. and On, R. (2015). Predicting poverty and wealth from mobile phone metadata. Science, 350(6264), pp.1073-1076.

Choi, H. and Varian, H. (2012). Predicting the Present with Google Trends. Economic Record, 88, pp.2-9.

Wang, W., Rothschild, D., Goel, S. and Gelman, A. (2015). Forecasting elections with non-representative polls. International Journal of Forecasting, 31(3), pp.980-991.


Please rate this

How Fusing Internet of Things and Bicycles Could Revolutionize Air Quality Monitoring

12

September

2019

5/5 (1)

The unexpected irony

Earlier this year, researchers uncovered a strong association between (paediatric) asthma and exposure to traffic related air pollution. It was further found that approximately 4 million new asthma cases could be the result of the aforementioned traffic related air pollution – of which 64% will occur in urban centers (Achakulwisut, Brauer, Hystad, & Anenberg, 2019). Despite the “fresh air” we are surrounded by during our bike commute in the Netherlands, further reports outlined by the “LongFonds” revealed that asthma is one of the more commonly faced chronic diseases faced by children in the Netherlands (Longfonds, 2019).

Albeit rather ironic, could it perhaps be that the “healthy” biking culture engrained in our society actually exposes us to such traffic related air pollution, especially in denser populated areas such as the Randstad (an area in the Netherlands that covers the four largest cities representing one of the more densely populated areas in Europe)? What role can technology play in identifying problem areas and perhaps even resolving such issues?


A fusion of two worlds

Investments in the internet of things, once a hype that struggled with feasibility, are now bearing their fruits as scalable and realistic projects begin providing solutions to societal challenges. One project undertaken by the Dutch province Utrecht in collaboration with Civity (company focusing on smart cities / data platforms) and SODAQ (internet of things hardware and software) involved creating air quality monitoring stations mounted on bikes (bicycles for the Americans reading). Yes, you read that correctly – bikes (CEF DIGITAL, 2019).

Bike Sniffer_EC
Figure 1) Bike-mounted IoT air quality monitoring device

A dynamic element in a static world

How and why is mounting an air quality device onto a bike related to asthma? To answer that question, one needs to consider the current source of information for critical air-quality decisions. For a long time, established websites such as waqi.com have provided air quality information for specific locations (see figure 2). By utilizing a handful of measuring stations in a specific city, waqi is able to provide the air quality for the exact location where the stations are placed. One of the significant downsides to such a methodology is the static location of the station. For example, a biker on a busy road is exposed to different air quality than a static air quality station on top of a building in Amsterdam. Similarly, a biker exploring the local green park around his house faces different breathing conditions. It is evident what I am alluding to: the dynamic element of air quality measurements (by mounting them on bicycles) changes the way cities can be monitored.  Instead of a handful of measurement locations in a specific city, the IoT addition could provide a few thousand locations, enriching the data collected and hence providing a stronger quantitative support for solutions to the air quality problem (figure 3).

Figure 3) WAQI static air quality monitoring in Utrecht Source: (The World Air Quality Index project)
Figure 2) WAQI static air quality monitoring in Utrecht
Source: (The World Air Quality Index project)


The technology itself

The air quality devices are comprised of a two-part solution: hardware and the data platform. The hardware aspect solution consists of a custom development board (programmable through the Arduino IDE) with numerous onboard sensors (GPS, magnetometer, accelerometer, amongst others). This onboard accelerometer allows the device to register movement and only begin with air quality monitoring if it is in movement. Furthermore, the GPS tracks the location where the measurement was taken. The main feature, the air quality, is monitored through a PM 2.5 (particulate matter) sensor which accurately measures the amount of particulate mass concentration through laser scattering technology (SODAQ, 2018).

The information is then sent to a public dashboard every 10 seconds over the LTE-M network, a network developed to send data packages from IoT devices utilizing less energy than traditional cellular networks (a must for longevity of IoT devices).  To properly visualize the data monitored, a publicly accessible dashboard displays all of the bike routes as well as an option to aggregate the data of numerous bikes in the same area for a clear overview.


The potential implementation

The Dutch choose their bikes as their mode of transportation 36% of the time (TNS Opinion & Social, 2014).  Imagine if 1% of the Dutch population (17 million) was equipped with this air quality monitoring device (Worldometer). This would imply that 61,200 (36% of the 1%) people would be using their IoT-enhanced bicycles. If they would use their bicycle for 20 minutes a day on average, this would imply over 7,344,000 data points being created every single day (assuming the standard 10 second measurements).

Figure 2) Bike-mounted air quality monitoring in Utrecht Source: (Civity)
Figure 3) Bike-mounted air quality monitoring in Utrecht
Source: (Civity)


To link it back to the recent study published – this IoT application (along with the potential millions of data points that it brings) could create a much more in-depth mapping of air quality of cities (as demonstrated by the comparison of figure 2 and figure 3). This can allow for institutions to tackle problem areas (specific streets) or potentially test interventions they make. Think about all the possible quantifications that are possible with such dynamic monitoring – whether it’s understanding the impact of recently introduced “milieu zones”, or whether it’s understanding the impact of the nearby rum factory on the air quality on your street. The quantification of the environment will allow for institutions to utilize data-driven decisions changes to ensure the vitality of the Dutch biking culture (and save children from asthma, of course).


Sources:

Achakulwisut, P., Brauer, M., Hystad, P., & Anenberg, S. C. (2019, April 11). Global, national, and urban burdens of paediatric asthma incidence attributable to ambient NO2 pollution: estimates from global datasets. Retrieved from https://www.sciencedirect.com/science/article/pii/S2542519619300464

CEF DIGITAL. (2019, August 22). Context Broker to empower Dutch cyclists to choose healthier routes. Retrieved from https://ec.europa.eu/cefdigital/wiki/display/CEFDIGITAL/2019/07/31/Context Broker to empower Dutch cyclists to choose healthier routes

Civity. (n.d.). Civity Dataplatform. Retrieved from https://dashboard.dataplatform.nl/sodaq/v2/groene_fietsroutes.html

Longfonds. (2019, September 11). Longfonds en artsen luiden noodklok over vieze lucht. Retrieved from https://www.longfonds.nl/nieuws/longfonds-en-artsen-luiden-noodklok-over-vieze-lucht

SODAQ. (2018). Sniffer Bike. Retrieved from https://sodaq.com/projects/sniffer-bike/

The World Air Quality Index project. (n.d.). World’s Air Pollution: Real-time Air Quality Index. Retrieved from https://waqi.info/#/c/52.371/4.865/12z

TNS Opinion & Social. (2014). Quality of TransportQuality of Transport. European Commission. Retrieved from https://ec.europa.eu/commfrontoffice/publicopinion/archives/ebs/ebs_422a_en.pdf

Worldometer. (n.d.). Netherlands Population (LIVE). Retrieved from https://www.worldometers.info/world-population/netherlands-population/

Please rate this